Describing regenerative ranching systems with data is challenging, but imperative.
Regenerative Ranching by the Numbers
02/21/2025
By: Kevin Watt & Shae Lynn Watt, Bookcliff Consulting
Describing regenerative ranching systems with data is challenging, but imperative. Producers, advocates, investors, and policymakers want to know they are putting their time, capital and focus on what matters most. Careful holistic data analysis can be a powerful tool to identify which practices are best linked to regenerative outcomes.
However, regenerative ranching systems are living systems, which makes them complex, interconnected, and cyclical. As a result, the same things that make describing these systems with data hard, make it a worthwhile effort.
So what makes it hard?
In the world of regenerative ranching, grazing management data is full of information that functions as both an input and an output. This is not usually how data works. In education, for example, when we ask “How many students in this tutoring program improved their test scores?”, we don’t have to contend with how the test scores impacted the duration or frequency of the tutoring program. But that’s exactly what happens with grazing data. The duration, frequency, and timing of grazing impacts the amount of grass that grows, which in turn impacts the desired duration, frequency, and timing of grazing.
And while the way we track grazing may be similar from ranch to ranch, the desired grazing outcomes and methodology for measuring those outcomes often varies, making it hard to know when comparison is appropriate. Two ranches might both be trying to increase biodiversity and soil health, but one could be measuring bird species and soil carbon while another measures plant diversity and compaction.
In addition, collecting data can take a lot of time, effort, and sometimes training. Ranchers are smart and diligent people, but time is usually not something they have to spare. It is important to remember that every moment spent monitoring is a moment not spent implementing the very regenerative practices we are aiming to measure.
So what makes it worthwhile?
There’s a joke in the data world that goes, “The best time to start collecting data is 10 years ago. The second best time is today.”
Thanks to amazing staff and partners like Point Blue Conservation Science, TomKat Ranch has years of valuable records that tell us about how plants, water, and soil have been changing on the ranch and where livestock have grazed, for how long, and in what density. This data has been a tremendous asset for making grazing plans and running experiments and trials.
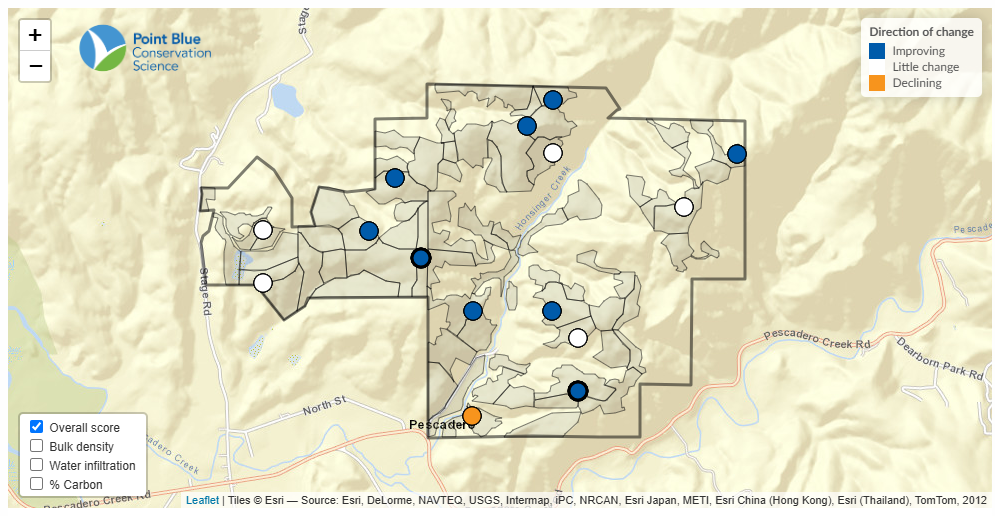
Many of Point Blue’s findings about soil, birds, vegetation, and water at TomKat Ranch can be found on the TomKat Ranch website. Here’s an example of an interesting way we are tracking progress.

In this map, we can see various soil monitoring points around the ranch. Each monitoring point is assigned an aggregate score based on three soil- health factors—bulk density (a measure of soil compaction), water infiltration (a measure of how well soil can absorb rainfall), and percent carbon (a measure of the carbon stored in the soil). At nine of the fifteen points on the map, the soil health score improved between the 2018 samples and the 2021 samples. At five of the points, the soil health score is relatively stable. At one point, it seems to be declining.
The composite score we’re measuring here allows us to account for some of the variation we expect in natural systems. If one metric is declining while the other two are improving, we want to understand those components together. This is similar to how your doctor assesses your health—they don’t just track blood pressure, heart rate, and temperature individually, they look at how these metrics, and more, are changing together to paint a picture of overall health.
These and other metrics have been useful for TomKat Ranch’s on-site management and are also a critical tool for our education and outreach efforts to promote regenerative principles and practices across the state and country.
What does 2025 have in store?
This year, we’re embarking on something both straightforward and more difficult than it might seem at first glance: identifying the impact of specific management choices on trends in outcome data. Not all grazing is the same, and changes in location, duration, timing, and density can have differing effects on diverse landscapes.
Making this connection between management and outcomes requires leaning into the complexity of both the ecological systems and the data itself. We are excited to be collaborating with other regenerative ranches in the central coast of California to pool management, monitoring, weather, and landscape data to add analytical power to our findings and understand best practices for our region.
One important step in this process has been to pair our ranch management and ecological outcome data with information from our on-site weather station as well as with data collected by the United States Geological Survey (USGS) including elevation, slope, and aspect (which direction on the compass the slope faces). Adding these factors gives us the ability to investigate not just how different management actions impact important outcomes, but to see if management yields different results in various weather conditions or in pastures with different physical characteristics (e.g. steep versus flat, north-facing versus south-facing, etc.).
We are excited to work with others on this effort to understand some of the connections between outcomes and practices that result from our holistic and regenerative management. Data is an incredible tool for storytelling, evaluating outcomes, and making comparisons, and can help us in our mission to discover, demonstrate, and de-risk the principles and practices that support thriving rangelands.